
Easily identify your emission hotspots
Trusted By 500+ businesses around the world


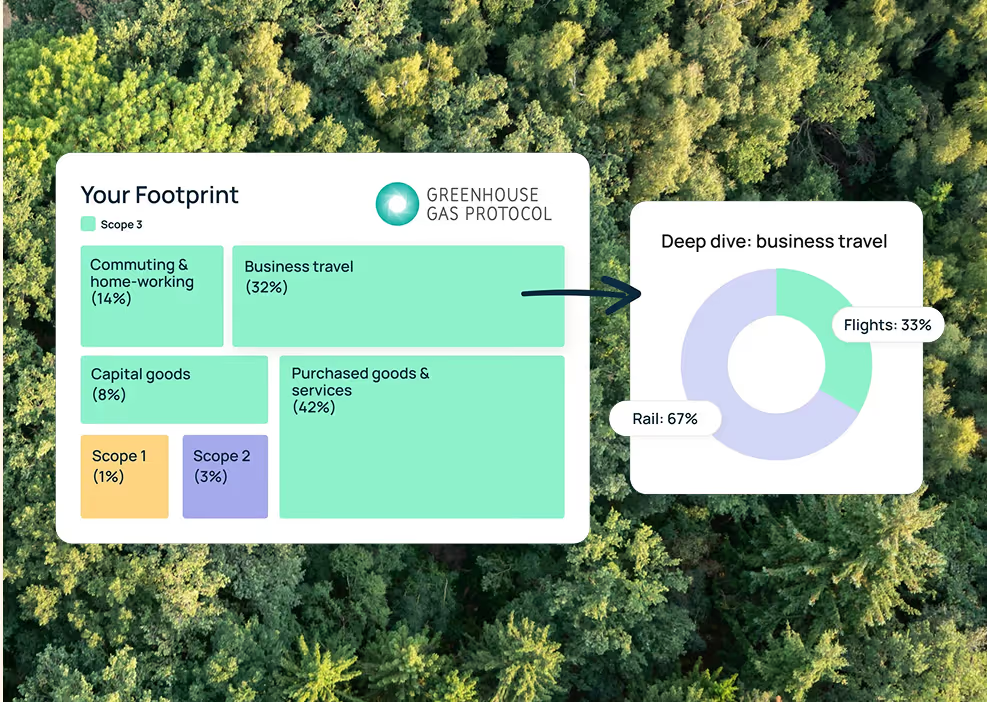
Your data is ready to view - no manual analysis needed
Once you've gathered your data, Seedling's calculation engine generates your GHG Protocol compliant carbon footprint, which is checked and approved by our experts.
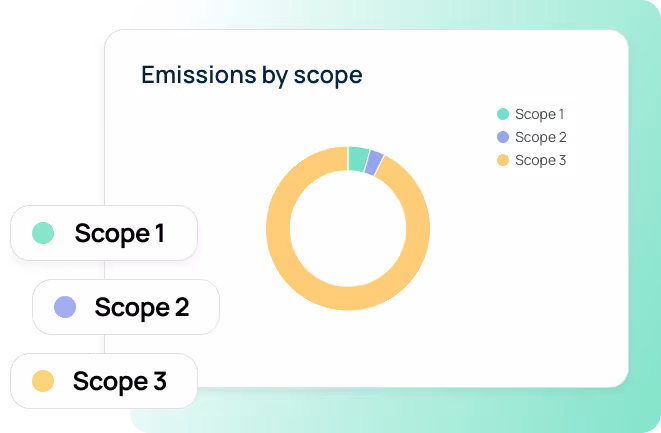
Your Seedling dashboard automatically segments your data the way you need it, such as by GHG Protocol scope, main category, and location.
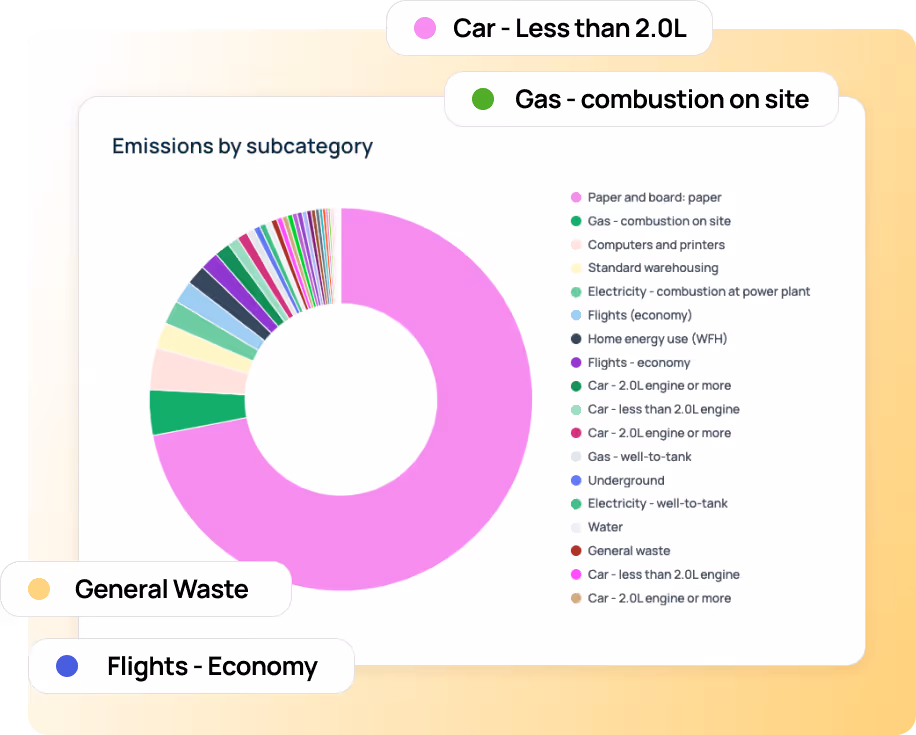
Get granular with our deep-dive function to visualise your data
Go a level deeper to get to understand the real source of your business emissions.
Why does this matter? This level of detail is key to being able to take action on improving your businesses footprint - high-level data isn't enough.
A Seedling adviser is on hand to help you interpret your results.
What our clients say
Hear from our satisfied Seedling clients


.png)


.png)
.svg)
.svg)


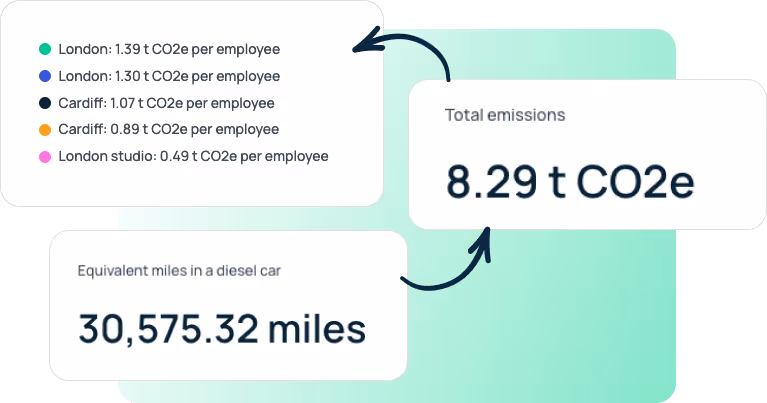
Get the key data points quickly
The key performance indicators you need are auto-calculated on your Seedling dashboard, including intensity metrics such as emissions per employee.
These metrics as essential to put emissions in the context of your business' growth, and enable intensity-based Net Zero targets.
Year-round one-to-one support

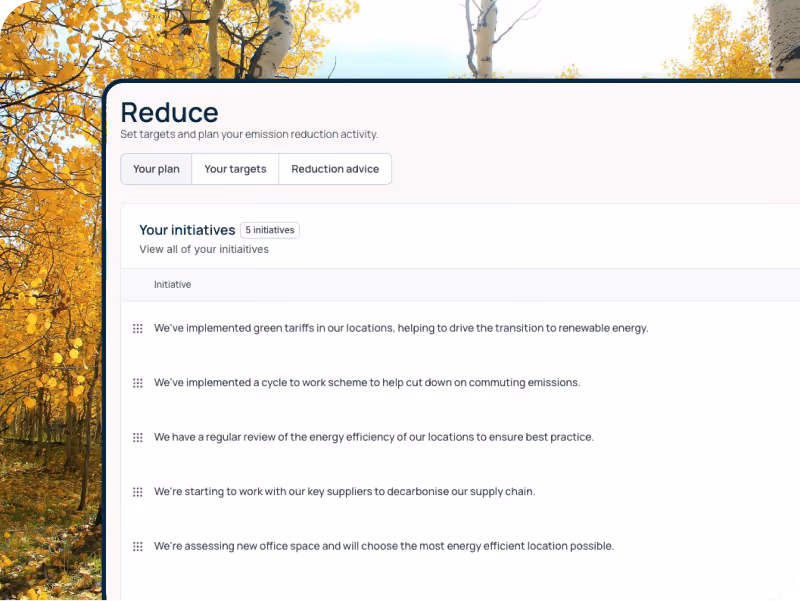
Now you understand your footprint, let's take action
You understand your hotspots - the next step is to set a Net Zero target and plan to reduce emissions. Learn how Seedling's powerful decarbonisation software and expert support can help.
Ready to get started?

Book a demo with one of our experts today, or get started right away for free.
.png)
.png)
.png)
.svg)
